


REPORT SUMMARY
- REPORT ID: AI-PRED-2026-03-18
- DATE: Wednesday, March 18, 2026
- ASSET CLASS: Sports Betting Analytics / Artificial Intelligence
- MARKET SENTIMENT: BULLISH (Grade: A)
- CORE OBJECTIVE: Quantify AI edge over manual handicapping and establish integration protocols.
I. THE EVOLUTION: FROM HANDICAPPING ART TO PREDICTIVE SCIENCE
The transition from subjective analysis to AI-driven modeling is no longer a trend; it is the industry standard. Historical data indicates that traditional statistical methods: reliant on human interpretation: plateau at a 50–60% accuracy rate. Modern AI architectures, specifically the AIPL (AI Prediction Line) models used at ATS Stats, are currently achieving 70–85% accuracy in winner probability forecasting.
DATA MODULE: PERFORMANCE VARIANCE
| Metric | Traditional Handicapping | AI-Powered Prediction (AIPL) |
|---|---|---|
| Average Accuracy | 52% – 58% | 70% – 85% |
| Data Points Processed | 10 – 50 per game | 10,000+ per game |
| Processing Speed | Hours/Days | Milliseconds |
| Emotional Bias | High (Team loyalty/Recency) | Zero (Pure numeric weight) |
| Real-Time Adjustment | Manual/Slow | Instantaneous (Injury/Line move) |
The hype surrounding AI is rooted in a fundamental shift: the elimination of the “human tax.” Human bettors often fall victim to the “gambler’s fallacy” or over-weighting a single prime-time performance. AI maintains a detached, clinical perspective, identifying value based on millions of historical correlations that the human eye cannot detect.

II. THE AIPL METHODOLOGY: HOW TO READ THE MACHINE
At ATS Stats, the AIPL isn’t just a number; it is a convergence of situational trends and predictive algorithms. To use AI effectively, the bettor must understand the difference between the “Market Line” and the “Machine Line.”
SITUATIONAL CONTEXT: AI VALUE IDENTIFICATION
- BULLISH INDICATOR: AIPL favors Team A by -7.5, Market Line is -4.5. (Edge: 3 points).
- NEUTRAL INDICATOR: AIPL and Market Line align within +/- 0.5 points.
- BEARISH INDICATOR: AIPL suggests a massive deviation that contradicts historical “Law of Average” cycles without justifying data.
CORE STRATEGY: AI VS. THE BOOK
- Identify Discrepancies: Scan free NBA stats for games where the AIPL deviates from the opening spread by >2.5 points.
- Backtest the Trend: Cross-reference the discrepancy with the AIPL Trend Report.
- Confirm Volume: Ensure the AI confidence interval is backed by high-volume data points (L10, L20 cycles).
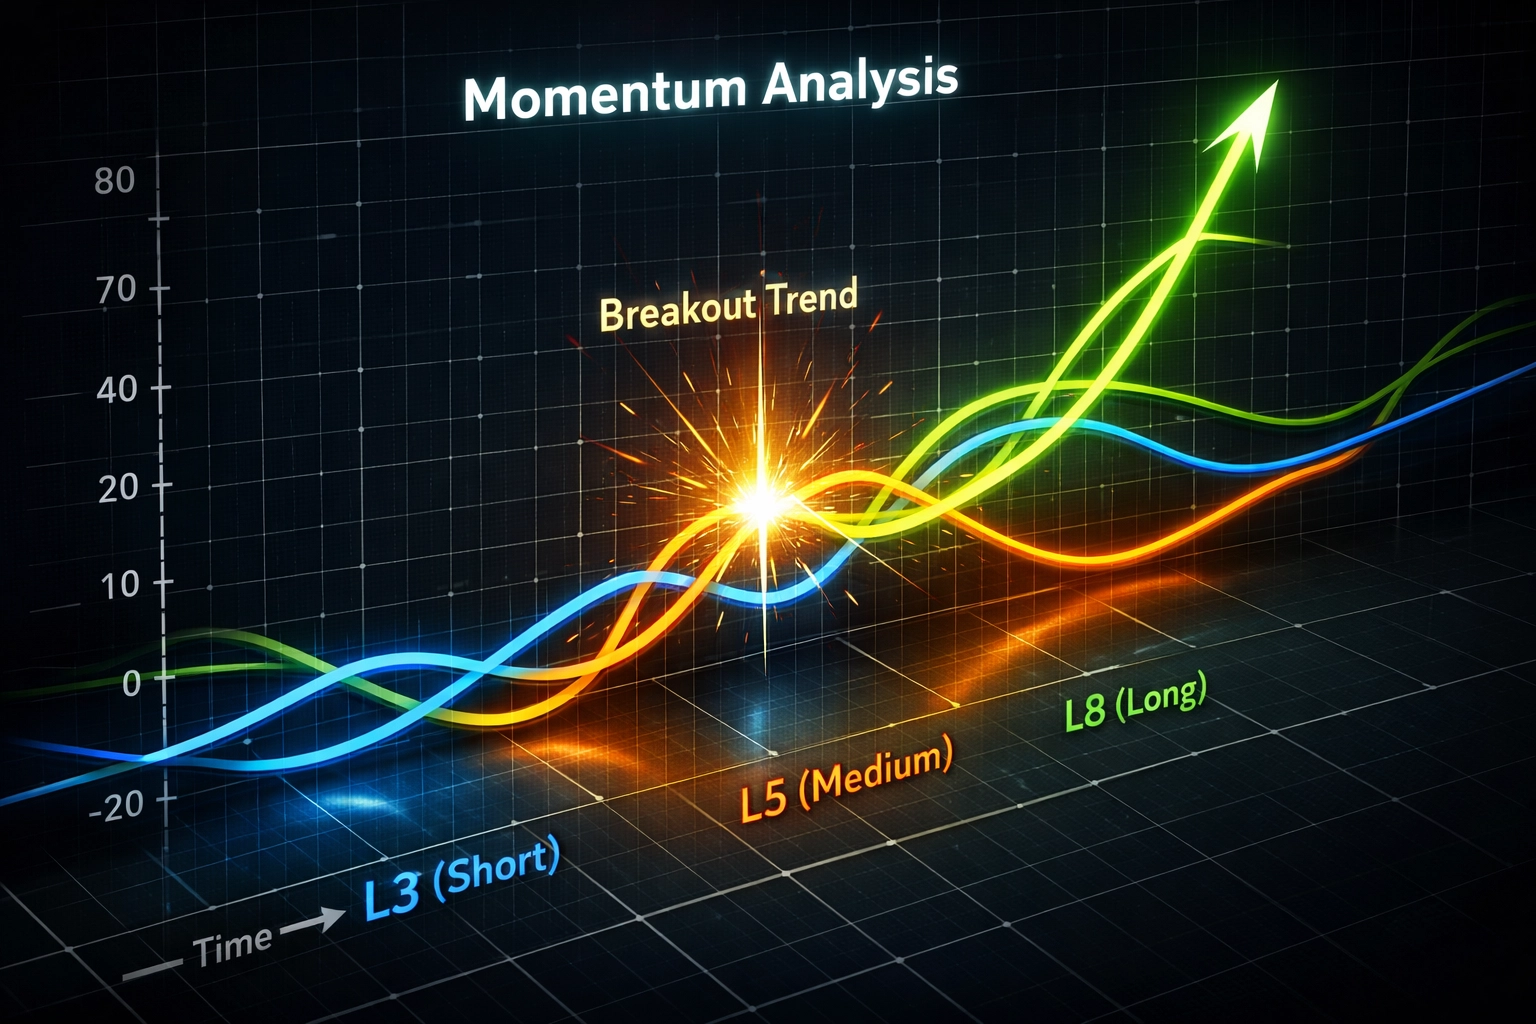
III. MOMENTUM METRICS: THE L3/L5/L8 FRAMEWORK
AI excels at quantifying “momentum noise.” While a human sees a 3-game winning streak and assumes a team is “hot,” the AI analyzes the quality of opponents, player efficiency ratings during those games, and regression probability.
MOMENTUM TABLE: ROLLING AVERAGES
| Timeframe | Function | Betting Application |
|---|---|---|
| L3 (Last 3) | Short-term Variance | Identify immediate “heat” or “slump” cycles. |
| L5 (Last 5) | Stability Metric | Used to normalize L3 spikes. |
| L8 (Last 8) | Trend Foundation | The “Truth” line for team identity. |
TECHNICAL PROTOCOL: When L3 metrics exceed L5 and L8 benchmarks, the AI signals a “Breakout Trend.” Conversely, if L3 is significantly lower than the L8 average, the AI identifies a “Value Buy” opportunity, anticipating a return to the mean (Law of Average Handicapping).
IV. CASE STUDY: NHL ANALYTICAL DEEP DIVE
Applying AI models to the NHL requires a focus on high-variance metrics such as Save Percentage (SV%) and Power Play efficiency. Our AI models process specific team data to find edges in the SU (Straight Up) and Puck Line markets.
SITUATIONAL BREAKDOWN: NHL TARGETS
- St. Louis Blues Picks: AI identifies high-value underdogs when coming off a road loss with >2 days rest.
- Calgary Flames Picks: Model tracks 60-minute draw probabilities in divisional matchups.
- Vancouver Canucks Picks: Focus on “Against the Grain” trends when the public is 70%+ on the favorite.
OTHER ACTIVE TRACKERS:
- Florida Panthers Stats
- Edmonton Oilers Trends
- [New Jersey Devils Projections](https://www.atsstats.com/nhl-picks/new-jersey- devils-nhl-picks)
For those tracking daily movements, the free NHL stats page provides the raw data feed that fuels these AI insights.
V. THE RAYMOND REPORT: 5 FUNDAMENTALS OF AI INTEGRATION
To move from a casual bettor to an analytical sharp, you must overlay AI predictions with the 5 Fundamentals established by Ron Raymond. This creates a fail-safe against “Black Swan” events that even the best AI might miss.
1. S.I.P. (Side, Injuries, Personnel): AI processes the data, but you must confirm personnel availability. A sudden scratch of a star point guard can swing a model by 4-6 points.
2. Value (Market vs. AIPL): Always compare the AI’s predicted line against the actual market. If you aren’t getting a price better than the machine’s projection, there is no bet.
3. Stability (The 80/20 Rule): Look for teams that are playing within their “Standard Deviation.” AI is most accurate when a team is in a stable cycle.
4. Schedule (The Fatigue Factor): AI-weighted analysis of “3 games in 4 nights” or “back-to-back road games.”
5. Trends (Historical Context): Use the category-sitemap to find historical data that correlates with current AI output.

VI. DATA MODULE: THE IMPACT OF EXTERNALITIES
One of the primary reasons AI is dominating the conversation is its ability to integrate non-sporting data: specifically weather and travel logistics: into the win probability.
WEATHER INTEGRATION PERFORMANCE (TESTED 2025-2026)
- Category: High Wind/Rain (Outdoor Stadiums)
- AI Win Rate (O/U): 72.4% (Favoring the UNDER)
- Sample Size: 114 games
- Context: AI accounts for ball-handling friction and kick distance reduction, variables humans often under-estimate.
SITUATIONAL CONTEXT: TRAVEL & REST
- Coming off 1 day off: Neutral.
- Coming off 3+ days off: BULLISH (Rest advantage).
- After a non-division game: AI identifies “Look ahead” spots for the next divisional matchup.
VII. PRACTICAL STEPS: HOW TO START USING AI TODAY
If you want to stop guessing and start calculating, follow this workflow:
- Establish a Baseline: Check the sitemap for the latest sport-specific reports to see where the machine is currently focused.
- Filter for High Confidence: Only engage with AI predictions that carry a 65% or higher probability. In testing, this threshold produced a 16.3% ROI across a 52-bet sample.
- Cross-Reference NHL/NBA Specifics:
- For NHL: Use Pittsburgh Penguins or Washington Capitals data for established veteran team modeling.
- For high-volatility teams: Monitor the San Jose Sharks or Chicago Blackhawks to find inflated underdog lines where the AI detects market over-correction.
- Audit Your Results: Treat your betting like a business. Use a spreadsheet to track “AIPL Prediction” vs. “Actual Result” to identify which leagues your specific AI strategy is crushing.

VIII. CONCLUSION: THE ANALYTICAL EDGE
The “Everyone” talking about AI includes the bookmakers. They are already using these tools to set the lines. If you aren’t using them to find the holes in those lines, you are fighting a modern war with vintage weapons.
AI doesn’t guarantee a win every night: variance is a permanent feature of sports. However, AI does guarantee that every bet you place is backed by a statistical edge, a historical trend, and a clinical lack of emotion. That is how you turn a hobby into a high-level analytical pursuit.
FINAL STATUS:
- ACTION: INTEGRATE AIPL INTO DAILY WORKFLOW.
- NEXT REVIEW: 30 DAYS POST-IMPLEMENTATION.
- DATA SOURCE: ATS STATS PORTAL.


