


SYSTEM REPORT: ADVANCED ANALYTICS & PREDICTIVE MODELING
DATE: March 19, 2026
SUBJECT: INTEGRATION OF PVI, SOS, AND ATS MATRIX FOR NFL/NBA
AUTHOR: ATS STATS ANALYTICS DIVISION
SYSTEM OVERVIEW: THE RAYMOND REPORT METHODOLOGY
The transition from casual wagering to professional-grade sports betting models requires a shift from narrative-based decision-making to data-integrated frameworks. The Raymond Report identifies three fundamental pillars: 60% situational trends, 20% value (PVI), and 20% health/sentiment (SBI). This report focuses on the technical interplay between the Power Value Indicator (PVI), Strength of Schedule (SOS), and the ATS Matrix.
[PVI] POWER VALUE INDICATOR: QUANTIFYING TRUE MARKET VALUE
The PVI is a proprietary metric used to establish the “Fair Market Value” of a team relative to the oddsmakers’ point spread. It eliminates public bias and focuses on raw performance metrics: Straight Up (SU) win percentage, opponent difficulty, and adjusted margin of victory.
PVI CALCULATION COMPONENTS:
- SU Record Factor: Weighted performance over L10 and L30 games.
- Opponent Coefficient: Average PVI of the previous five opponents.
- Scoring Margin Efficiency: Point differential vs. expected market output.
PVI VALUE ASSESSMENT TABLE
| Market Spread | PVI Line | Value Differential | Sentiment | Recommendation |
|---|---|---|---|---|
| -7.5 | -10.0 | +2.5 | BULLISH | Value on Favorite (A+) |
| +3.0 | -1.5 | +4.5 | VERY BULLISH | High Value Underdog (A) |
| -4.5 | -3.0 | -1.5 | BEARISH | Overvalued Favorite (C) |
| PK | +2.0 | -2.0 | NEUTRAL | Market Alignment (B) |

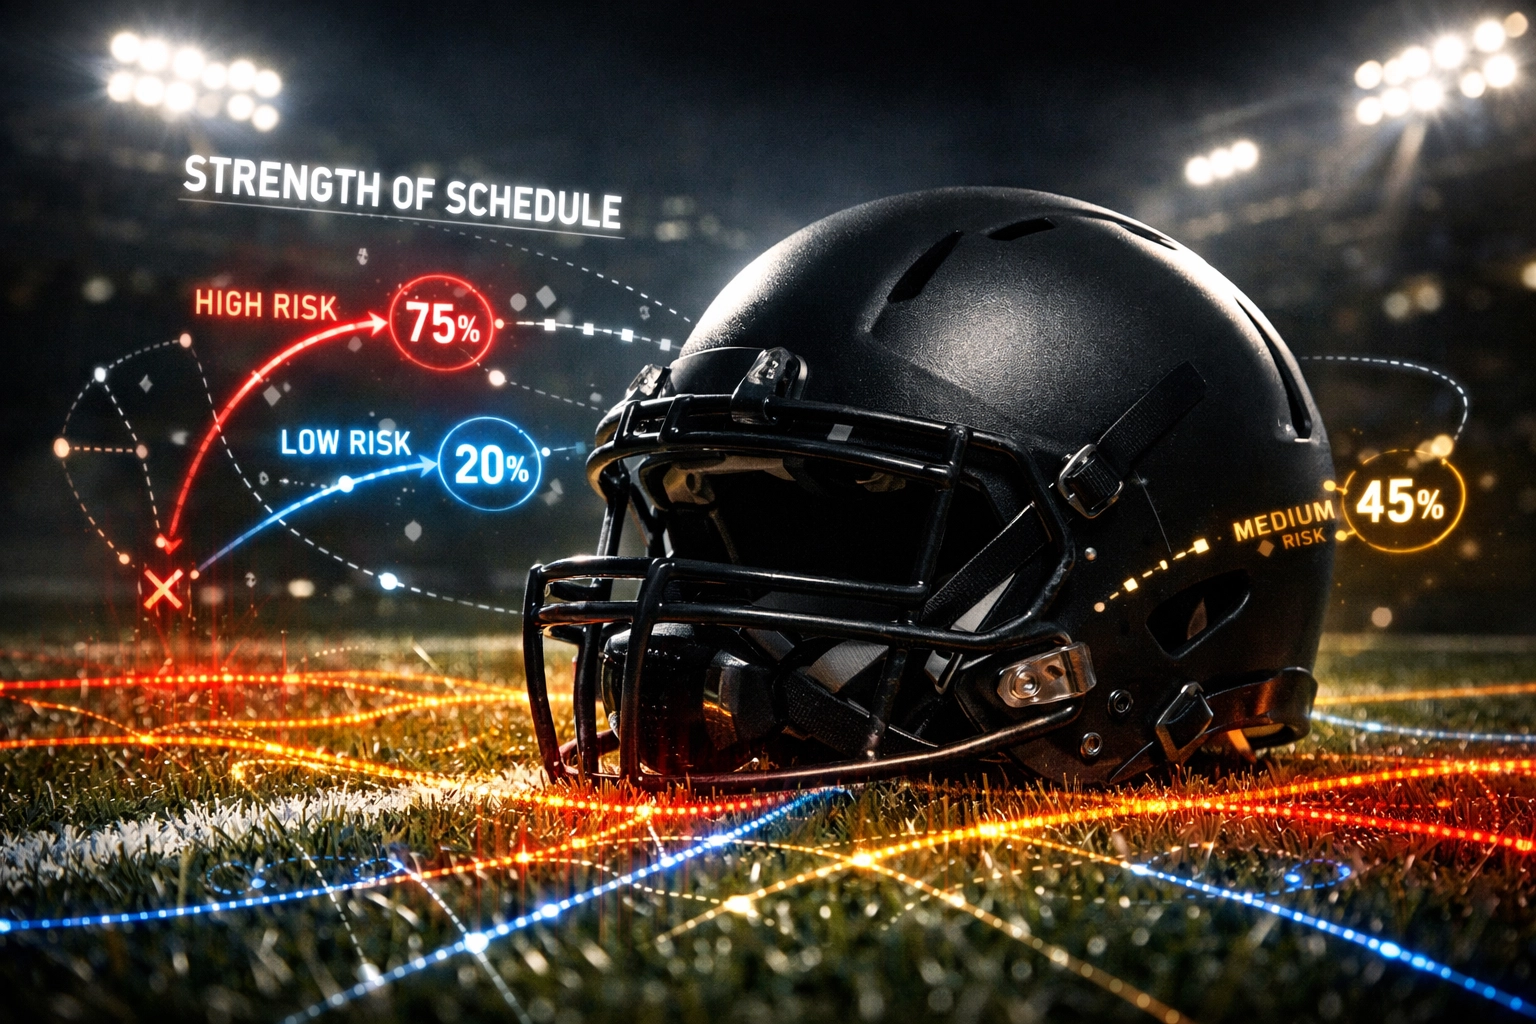
[SOS] STRENGTH OF SCHEDULE & THE PVI SOS DATABASE
Raw ATS records are misleading without situational context provided by the Strength of Schedule (SOS). The PVI SOS database at ATS Stats cross-references a team’s PVI against the average PVI of their upcoming opponents. This creates a “difficulty gradient” that predicts regression or breakout potential.
KEY SOS DESCRIPTORS:
- High SOS / Low PVI: Indicators of “False Weakness.” Often results in undervalued underdogs in non-division games.
- Low SOS / High PVI: Indicators of “Market Inflation.” Typically leads to overvalued favorites coming off 3+ game win streaks.
- Neutral SOS: Benchmark performance for nba ai predictions and NFL model calibration.
SITUATIONAL SOS FILTERS:
- Conference SOS: Performance vs. intra-conference opponents.
- Division SOS: Weighting for rivalry familiarity (NFL specific).
- Travel SOS: Impact of back-to-back road games or “3 in 4 nights” (NBA specific).
[ATS MATRIX] MULTI-YEAR PERFORMANCE BENCHMARKING
The ATS Matrix is a technical dashboard that tracks performance across 3-year, 5-year, and 7-year cycles. It allows analysts to identify “Cycle Convergence,” where short-term streaks meet long-term historical norms.
ATS MATRIX: SAMPLE PERFORMANCE MODULE
| Timeframe | ATS Record | Cover % | ROI % | Trend Direction |
|---|---|---|---|---|
| L10 Games | 7-3-0 | 70% | +36.4% | Accelerating |
| 2025-26 Season | 42-38-2 | 52.5% | +1.2% | Mean Reversion |
| 3-Year Avg | 128-120-5 | 51.6% | -0.4% | Neutral |
| 7-Year Avg | 310-280-12 | 52.5% | +1.8% | Bullish |
MATRIX UTILITY:
By utilizing the ATS Matrix, bettors can determine if a team is “Due” for a correction via the Law of Average Pick (LOAP). For example, if an NBA team is covering at 80% over their last 10 games but has a 7-year average of 52%, the model triggers a “Bearish” regression alert.

[NBA AI PREDICTIONS] INTEGRATING MACHINE LEARNING
Modern wagering requires the integration of high-velocity data. Our sports betting models utilize AI to process thousands of data points including player efficiency ratings (PER), lineup volatility, and the SBI (Sentiment & Betting Index).
NBA AI PREDICTION INPUTS:
- Rest Advantage: 0 days vs. 1 day vs. 2+ days.
- Offensive/Defensive Efficiency: Adjusted for SOS.
- Market Sentiment: Public betting % vs. Sharp money flow.
CASE STUDY: UNDERDOG VALUE IN NBA
- Scenario: Home Underdog (+4.5)
- PVI Status: B+
- SOS Rank: Top 5 (Schedule getting easier)
- ATS Matrix: 65% cover rate as Home Dog over 5 years.
- AI Forecast: Predicted line of +1.5.
- Outcome: High-probability value play on the spread.
[NFL SPECIFIC] PVI SOS & DIVISIONAL PARITY
In the NFL, the PVI SOS becomes critical during Week 14-18 when playoff motivation and injury attrition peak. The NFL Week 4 data often sets the baseline for these mid-season adjustments.
TECHNICAL NFL INDICATORS:
- COW-COL (Circle of Wins/Circle of Losses): Tracking cyclical momentum within divisions.
- Days Rest: Significant impact on PVI for Monday Night Football (MNF) participants.
- Market Index: Comparing open vs. current lines to identify “Value Traps.”
[MARKET ANALYTICS] THE 80% CLUB & TOP 25 OPTIONS
Data-driven wagering culminates in identifying high-confidence trends. The 80% Club highlights situational parameters that have historically yielded an 80% or higher success rate.
SAMPLE 80% TREND (NBA):
- Criteria: Road favorite (-3.5 to -6.5).
- Condition: Coming off a double-digit loss as a favorite.
- Historical Sample: 45-11 ATS (80.3%) over the last 10 seasons.
TOP 25 OPTIONS:
A daily ranking of games where the PVI, SOS, and ATS Matrix align with maximum statistical significance. This ranking serves as the primary filter for professional bankroll allocation.
[EXECUTION] THE LAW OF AVERAGE PICK (LOAP) STRATEGY
The LOAP strategy dictates that sports outcomes, over a long enough horizon, will return to their established historical mean.
LOAP EXECUTION STEPS:
- Identify Extremes: Find teams covering >70% or <30% over a 20-game sample.
- Verify PVI: Ensure the PVI doesn’t support the current streak (i.e., the team is “overachieving”).
- Check SOS: Determine if the streak was fueled by a weak schedule.
- Execute Contrarian Position: Bet on the mean reversion (regression).
| Metric | Bullish Indicator | Bearish Indicator |
|---|---|---|
| PVI | PVI Line < Market Line (Undervalued) | PVI Line > Market Line (Overvalued) |
| SOS | High Past SOS / Low Future SOS | Low Past SOS / High Future SOS |
| ATS Matrix | L10 < 3-Year Avg | L10 > 7-Year Avg |
| Scoring Avg | Scoring > Expected vs. Defense | Scoring < Expected vs. Defense |
[CONCLUSION] THE DATA-FIRST EDGE
Successful wagering on NFL and NBA is not about “picking winners.” It is about identifying price discrepancies between the market (Oddsmakers) and reality (PVI/SOS). By utilizing the technical tools at ATS Stats, such as the ATS Matrix and the Raymond Report, bettors transition from gambling to disciplined mathematical speculation.
TECHNICAL SUMMARY RECAP:
- PVI: Establish the real line.
- SOS: Filter out schedule-induced noise.
- ATS Matrix: Historical context for regression.
- AI Models: High-velocity situational forecasting.
For access to the full PVI SOS database and daily NBA AI predictions, consult the Free NBA Stats or Free NHL Stats dashboards for real-time updates.

END OF REPORT


