Welcome back to ATS STATS Tutorials — where we break down the tools behind the numbers, not just the picks.
In Tutorial #2, we dive into ATS Stats Computer Picks and explain how the ATS Forecast is built, what it’s telling you, and how to actually use it when analyzing a game.
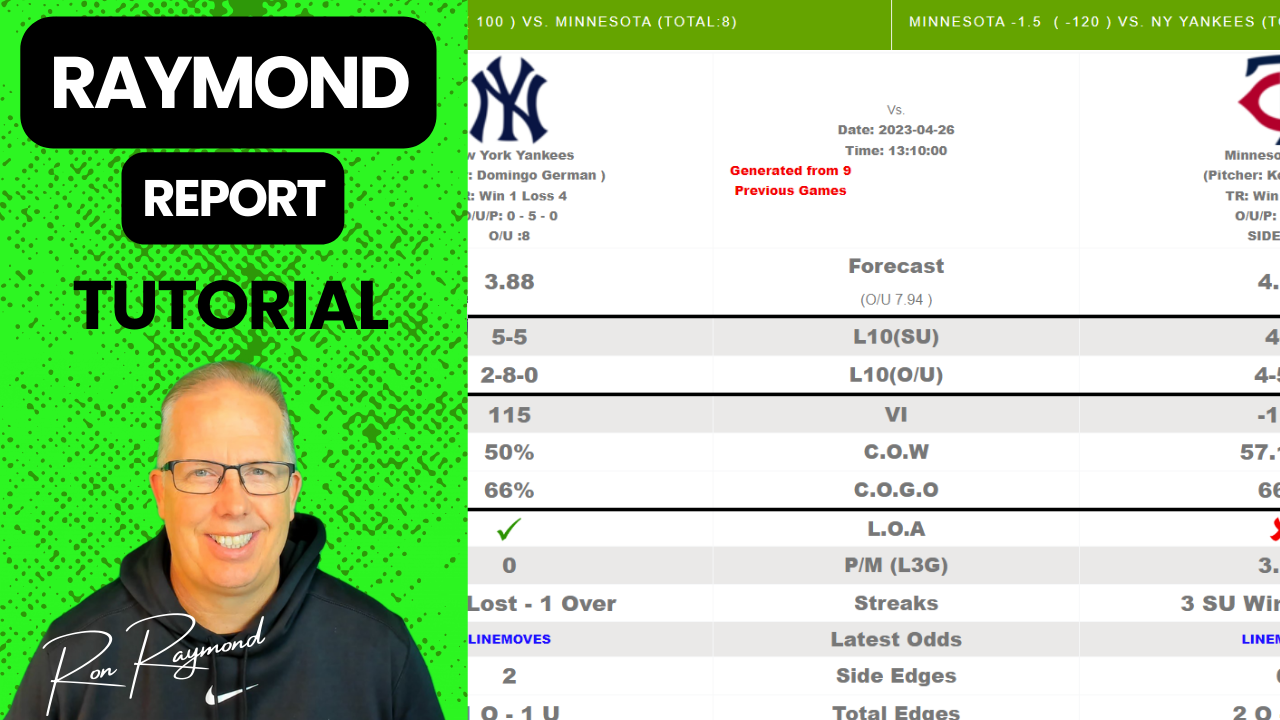
Using today’s NHL card, we walk through the first matchup step-by-step and break down every key feature, including:
-
What the ATS Forecast score represents
-
How past situational data drives the projection
-
The role of C.O.W, C.O.G.O, SOS, and Value Index (V.I.)
-
Why this is a forecast tool, not a blind pick button
-
How investors use the forecast to confirm or challenge market numbers
The ATS Forecast combines historical situations, current matchup context, and Vegas pricing to project tomorrow’s score — giving you a market-based starting point instead of guessing.
📊 View ATS Computer Picks here: https://www.atsstats.com
✅ More tutorials coming — covering every major ATS STATS feature
Ray the Bull Approved 🟢
Understand the forecast. Respect the market. Bet with structure.
#ATSStats #ComputerPicks #ATSForecast #SportsBetting #NHLBetting #Handicapping #SportsAnalytics